James Webb Space Telescope Feed Post
Hot Gas-Giant Exoplanet WASP-43 b (MIRI Phase Curve)
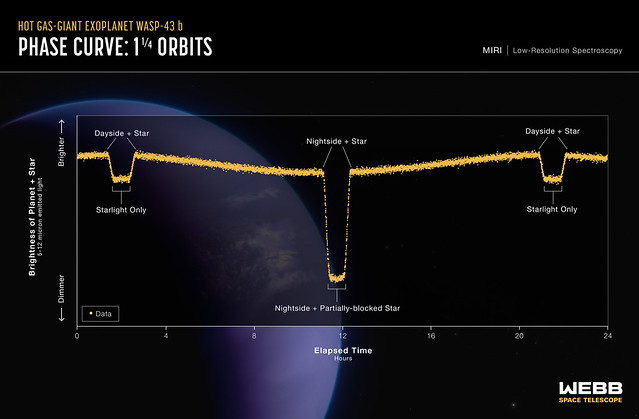
This light curve shows the change in brightness of the WASP-43 system over time as the planet orbits the star. This type of light curve is known as a phase curve because it includes the entire orbit, or all phases of the planet. Because it is tidally locked, different sides of WASP-43 b rotate into view as it orbits. The system appears brightest when the hot dayside is facing the telescope, just before and after the secondary eclipse when the planet passes behind the star. The system grows dimmer as the planet continues its orbits and the nightside rotates into view. After the transit when the planet passes in front of the star, blocking some of the starlight, the system brightens again as the dayside rotates back into view. This graph shows more than 8,000 measurements of 5- to 12-micron mid-infrared light captured over a single 24-hour observation using the low-resolution spectroscopy mode on Webb’s MIRI (Mid-Infrared Instrument). By subtracting the amount of light contributed by the star, astronomers can calculate the amount coming from the visible side of the planet as it orbits. Webb was able to detect differences in brightness as small as 0.004% (40 parts per million). Since the amount of mid-infrared light given off by an object is directly related to its temperature, astronomers were able to use these measurements to calculate the average temperature of different sides of the planet. Learn more: science.nasa.gov/missions/webb/nasas-webb-maps-weather-on... Credits: Illustration: NASA, ESA, CSA, Ralf Crawford (STScI) Science: Taylor Bell (BAERI), Joanna Barstow (The Open University), Michael Roman (University of Leicester) Image Description: Graphic titled Hot Gas-Giant Exoplanet WASP-43 b: Phase Curve 1 ¼ Orbits; MIRI Low-Resolution Spectroscopy. y-axis: Brightness of Planet + Star (5 to 12 micron emitted light), ranging from dimmer at bottom to brighter at top. x-axis: Elapsed Time (Hours) ranging from 0 to 24 in increments of 4. Thousands of orange data points form a thick, clear pattern, with no outliers and very little scatter. Curve forms a subtle sine wave with crests from 2-4 hours and 20-24 hours, and trough in the middle from 10-14 hours. Curve interrupted by 3 prominent U-shaped valleys: 2 shallow valleys at the wave crests at 2 hours and 22 hours, and a very deep valley in the middle of the trough at 12 hours. The base of the shallow valleys at 2 and 22 hours are labeled “starlight only,” with tops of valley walls on either side labeled “dayside + star.” Center of deep valley at 12 hours is labeled “nightside + partially-blocked star,” with tops of valley walls on either side labeled “nightside + star.” Image & Description by NASA
